Political partisanship lead to money backed by nothing …
“Capitalism is not broken. The problem is that we haven’t had sound money since 1971.” – Jesse Colombo
Notice how he makes ZERO mention of the actual drivers of our inequality and other ills of our system.
— Jesse Colombo (@TheBubbleBubble) April 22, 2019
Capitalism is not broken. The problem is that we haven't had sound money since 1971: pic.twitter.com/Cna4CSRyMs
Oh yes, a lack of hard money has allowed governments around the world to print paper fiat backed that nothing to purchase real assets such as gold and property. In the case of the U.S. in particular, the founding Father’s would certainly be shocked by the level of control of government on the people. Financial engineering and market manipulation have become par for the course.
So rich got richer and the poor got poorer …
“Political partisanship has risen in near-perfect correlation with wealth-income inequality. The system is rigged to benefit the few at the expense of the many [with] the vast majority of all income gains flow[ing] the top 0.1%, … strip-mining the productive class via inflation and taxes.” – Zero Hedge
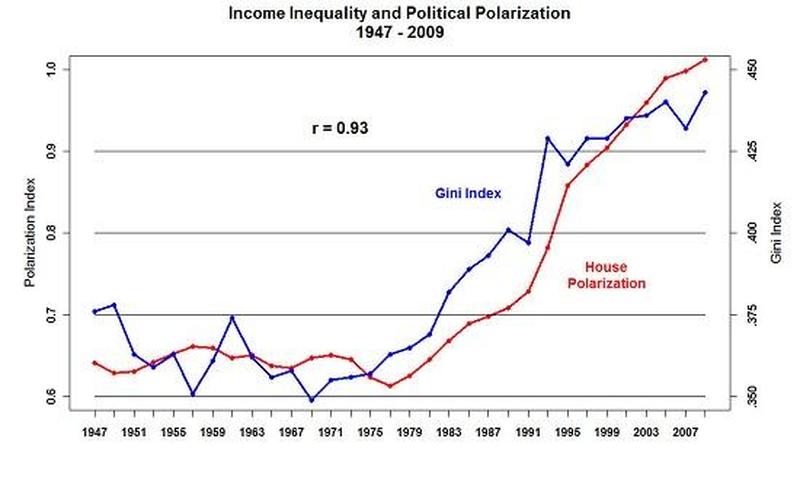
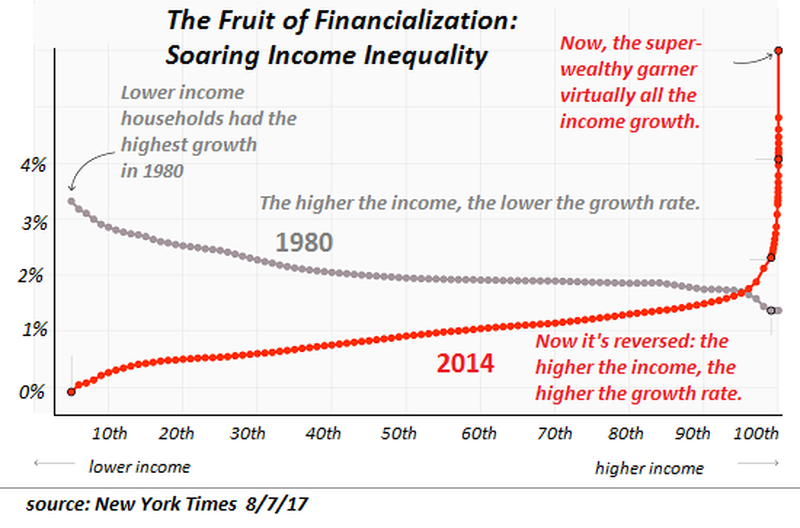
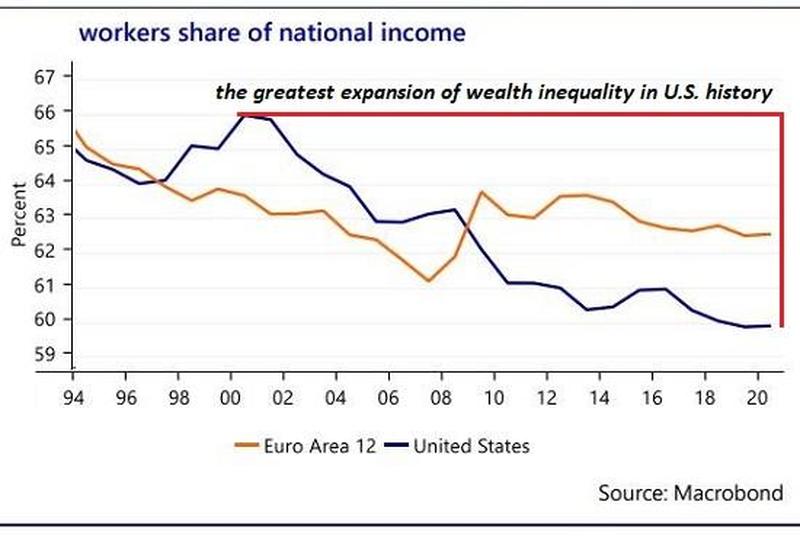
U.S. household wealth recently hit a record of 535% of the GDP, while the historic average since 1952 is 384%. However, U.S. wealth concentration seems to have returned to levels last seen during the Roaring Twenties. In 1929, before Wall Street’s crash unleashed the Great Depression, the top 0.1% richest adults share of total household wealth was close to 25%, according to Gabriel Zucman, Economics Professor, UC Berkeley.
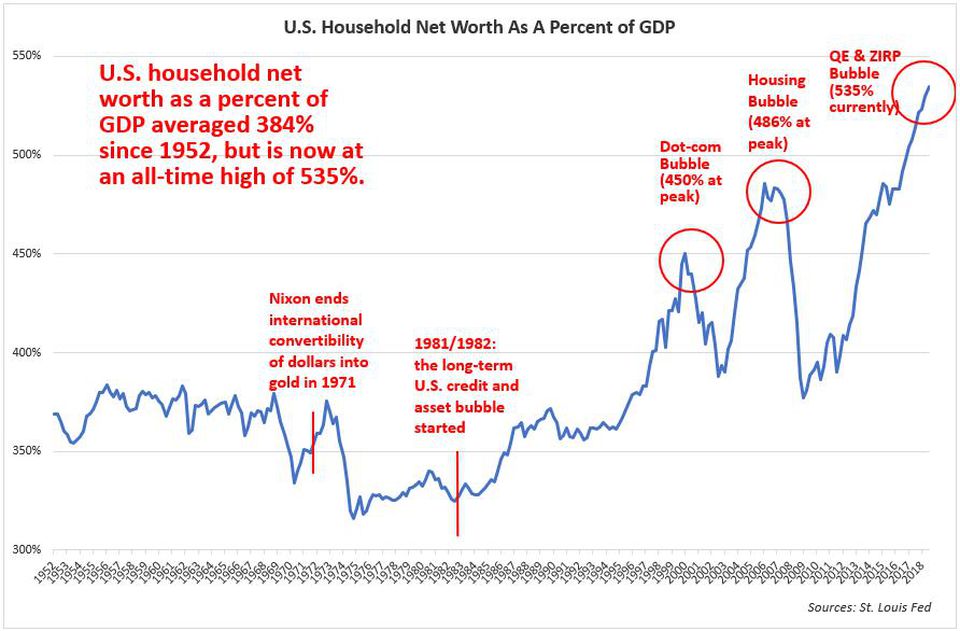
“America’s growing wealth inequality is not the fault of capitalism, but of central bank market intervention, which goes against the very principles of capitalism. What is lost on left-leaning economists and politicians is the fact that America’s wealth inequality is not a permanent situation, but a temporary one because the asset bubbles behind the wealth bubble are going to burst and cause a severe economic crisis.” – Jesse Colombo
As stocks kept going up.
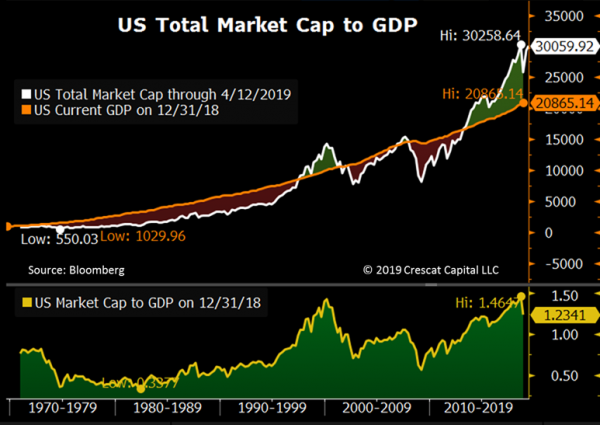
“The recent surge in stocks has pushed valuations back near all-time highs. Below, we show that the total US market cap-to-GDP ratio reached its highest ever last September at 1.46 prior to the 4th quarter market meltdown as measured by the Wilshire 5000 Index. The first panel of the chart below illustrates how the total US equity market capitalization tends to fluctuate above and below GDP across economic cycles. In the second panel, we can clearly see that valuations in this cycle went even higher than in the tech bubble. A multiple of 1.00 relative to GDP tends to be the median valuation over time. But valuations rarely stop at the median during bull and bear market cycles as the chart clearly shows. The truth is, the total US stock market’s estimation of its underlying business net worth is as stretched as it has ever been.” – Crescat Capital
The corruption continued,
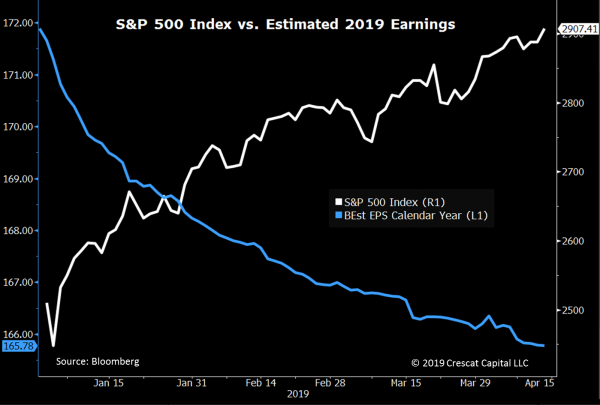
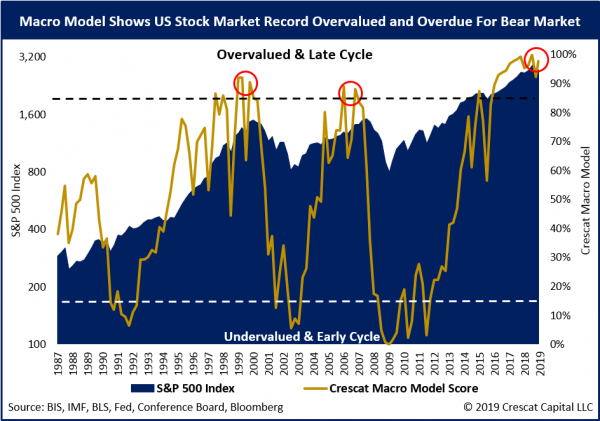
“It’s interesting to us how surging US stocks are in complete disconnect with the deteriorating fundamental outlook. Earnings estimates for 2019 in fact have been plunging all year while diverging significantly from sharply rising equity prices. This is not a positive set-up for stocks as we start the Q1 earnings season. In September 2018, we reached what we believe were and still are truly mania levels. We strongly believe US stocks are overdue for a bear market and the time of reckoning is near. The bear market started to unfold in the fourth quarter of last year in our view. But now we are retesting the September highs. Based on Crescat’s macro model score, and a myriad of other indicators, there is a strong probability that this rally will soon fail and that the bear market will resume.”
Leading to the United States became more fragile.
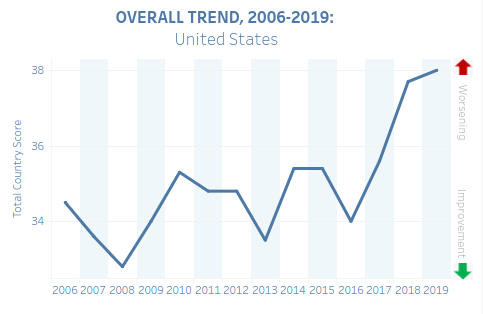
Let’s also consider third party data from The Fund For Peace, which indicates that the United States is becoming more fragile despite the fact that, overall, the world is becoming less fragile over time. Notice that, as the extraction of wealth from the working-class escalates from 2016 to today, so does the risk of fragility.
So smart money fled risk …
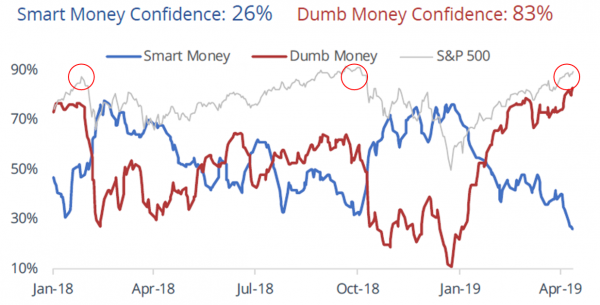
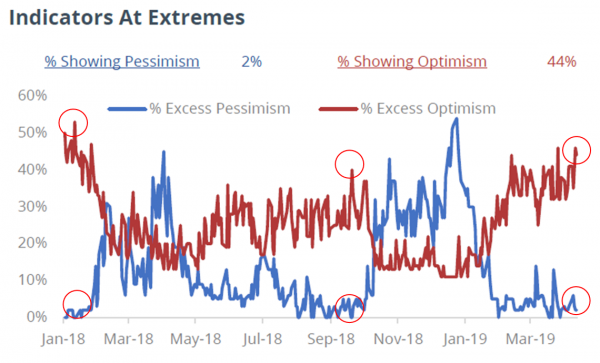
The recent stock market rally has remarkably similar fingerprints to the January 2018 and September 2018 speculative tops as shown by the two charts below courtesy of Jason Goepfert at sentimenTrader.com.
Jason’s smart versus dumb money indicators incorporate OEX put/call and open interest ratios, commercial hedger positions in equity index futures, and the current relationship between stocks and bonds. The smart-money indicator is currently near its lows while the dumb money one is near its highs. A similar wide spread between these two indicators preceded the market’s two steep selloffs last year. SentimenTrader also tracks 60+ market indicators and tallies the percentage of them showing extreme optimism versus extreme pessimism. As shown in the chart below, 44% of these indicators are registering extreme optimism levels in equity markets today. Conversely, only 2% of these indicators are showing significant levels of pessimism. Similar to the smart vs. dumb money spread, such divergences performed extremely well at identifying the last two interim market tops. Record bullishness sentiment rarely ends well for longs. Neither do extreme divergences between speculative longs and professional hedgers who are short.
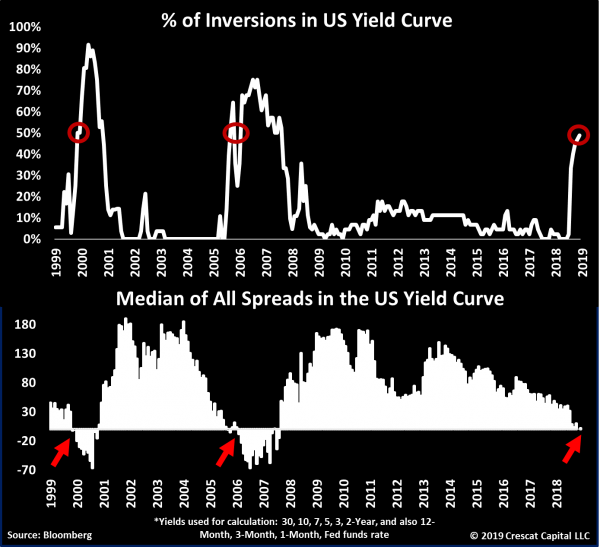
“Measuring inversions in the US yield curve – this model calculates all possible 44 spreads across US rates, and the percentage is now close to 50%, just as high as it was at the peak of the tech and housing bubbles. Historically, these elevated levels of inversions tend to be great times to own precious metals and sell US stocks. There is indeed a US business cycle as well as a global economic cycle. We believe both are ripe for a downturn.” – Crescat Capital
And central banks went on a gold-buying binge.
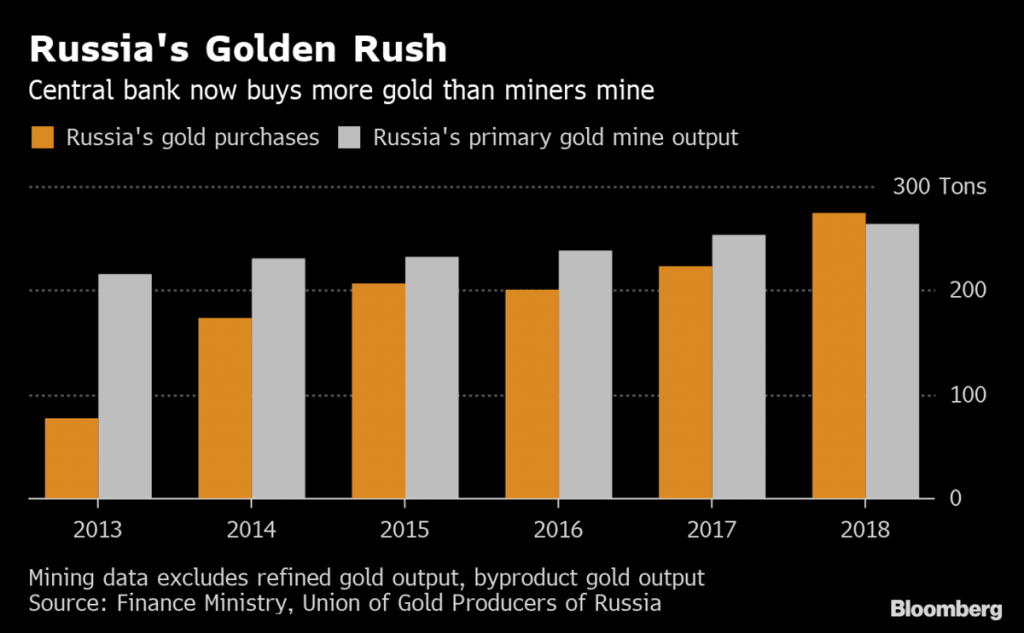
“Recent gold accumulations has little to do with safe havens and a lot to do with chipping away at the US dollar‘s role as the reserve currency. According to the World Gold Council, central banks backed up the truck for gold in 2018, buying 651.5 tonnes versus 375 tonnes in 2017. That’s the largest net purchase of gold since 1967. Among the top gold buyers was Russia, which all but liquidated its US Treasury holdings, to try and diversify away from the US dollar. Bloomberg reports that within a decade, the Russian central bank has quadrupled its bullion reserves, an effort that continues. In February, the Central Bank of Russia added a million ounces, the most since November 2018.” – Ahead of the Herd
Central banks added 90 tons of gold in the first two months of this year according to the latest report by the World Gold Council. This compares to 56 tons through the first two months of 2018 and ranks as the highest rate of growth since 2008. Globally, central bank gold holdings increased by a net 51 tons in February. It was the largest net increase in central bank gold reserves since October 2018. According to the WGC, a move to diversify reserves is driving the increased pace of central bank gold accumulation, diversification remains the key motivation for central banks to buy gold, as ongoing geopolitical and economic uncertainty continue to cast a shadow over the future.
According to the World Gold Council, “Despite a decade passing since the global financial crisis, times seem no less certain. Central banks reacted to rising macroeconomic and geopolitical pressures by bolstering their gold reserves. These actions are consistent with a recent survey commissioned by the World Gold Council: 76% of central banks view gold’s role as a safe haven asset as highly relevant, while 59% cited its effectiveness as a portfolio diversifier. And almost one-fifth of central banks signaled their intention to increase gold purchases over the next 12 months”.
And, according to Kitco Gold: “Although gold has failed to break above $1,400 an ounce since 2013, United Overseas Bank is bullish and thinks the metal can crack that level this year. The bank said in a note that gold needs to overcome a ‘stack of strong resistances’ that have stymied rallies in recent years and that ‘the underlying tone has clearly improved,’ reports Bloomberg. Another reason to be bullish on the metal is that the Basel III rules will be enforced in full in 2019. These rules say that gold held in an institution’s vaults or in trust now qualifies as ‘a 0 percent risk weighting for risk-based capital purposes.’ This means that gold will now be treated as safer and more like actual money. Nick Barisheff, CEO of BMG Group, writes that ‘Canadian banks are now free to add monetary gold to their increased reserve positions, and to treat it in the same as they would cash of AAA-rated government bonds.’
Final Thoughts
Follow the money – regardless of whether you’re a gold-bug or not, one cannot deny that a least some small portion of one’s portfolio should be allocated to gold!
Thanks for reading!
